   Min. 1st Qu.  Median    Mean 3rd Qu.    Max.
0.00 5.00 6.00 13.55 14.00 100.00 The Vibes from 2022
1 Introduction
Around this same time 2 years ago, I wrote a similarly short and (hopefully dissimilarly) crude post talking about the advent of “vibes based economics” as I’d seen it mentioned by other, more knowledgeable persons. The whole piece is rambling pontification, and I pray I’ve got better at these writings since then. I concluded it by talking about the need to maintain faith despite the malaise and that, “luckily,” spending hadn’t appeared to drop despite poor economic sentiment. In retrospect, this was not luck, but rather a feature of the new vibe. There is a growing disconnect between how people describe broader economic conditions, and how they operate under them. This disconnect is not an entirely new phenomenon, but it appears to have been particularly pronounced over these past four years. Consider the figure below from the Institute of Politics at Harvard Kennedy School (“Harvard IOP Youth Poll” (2023)):
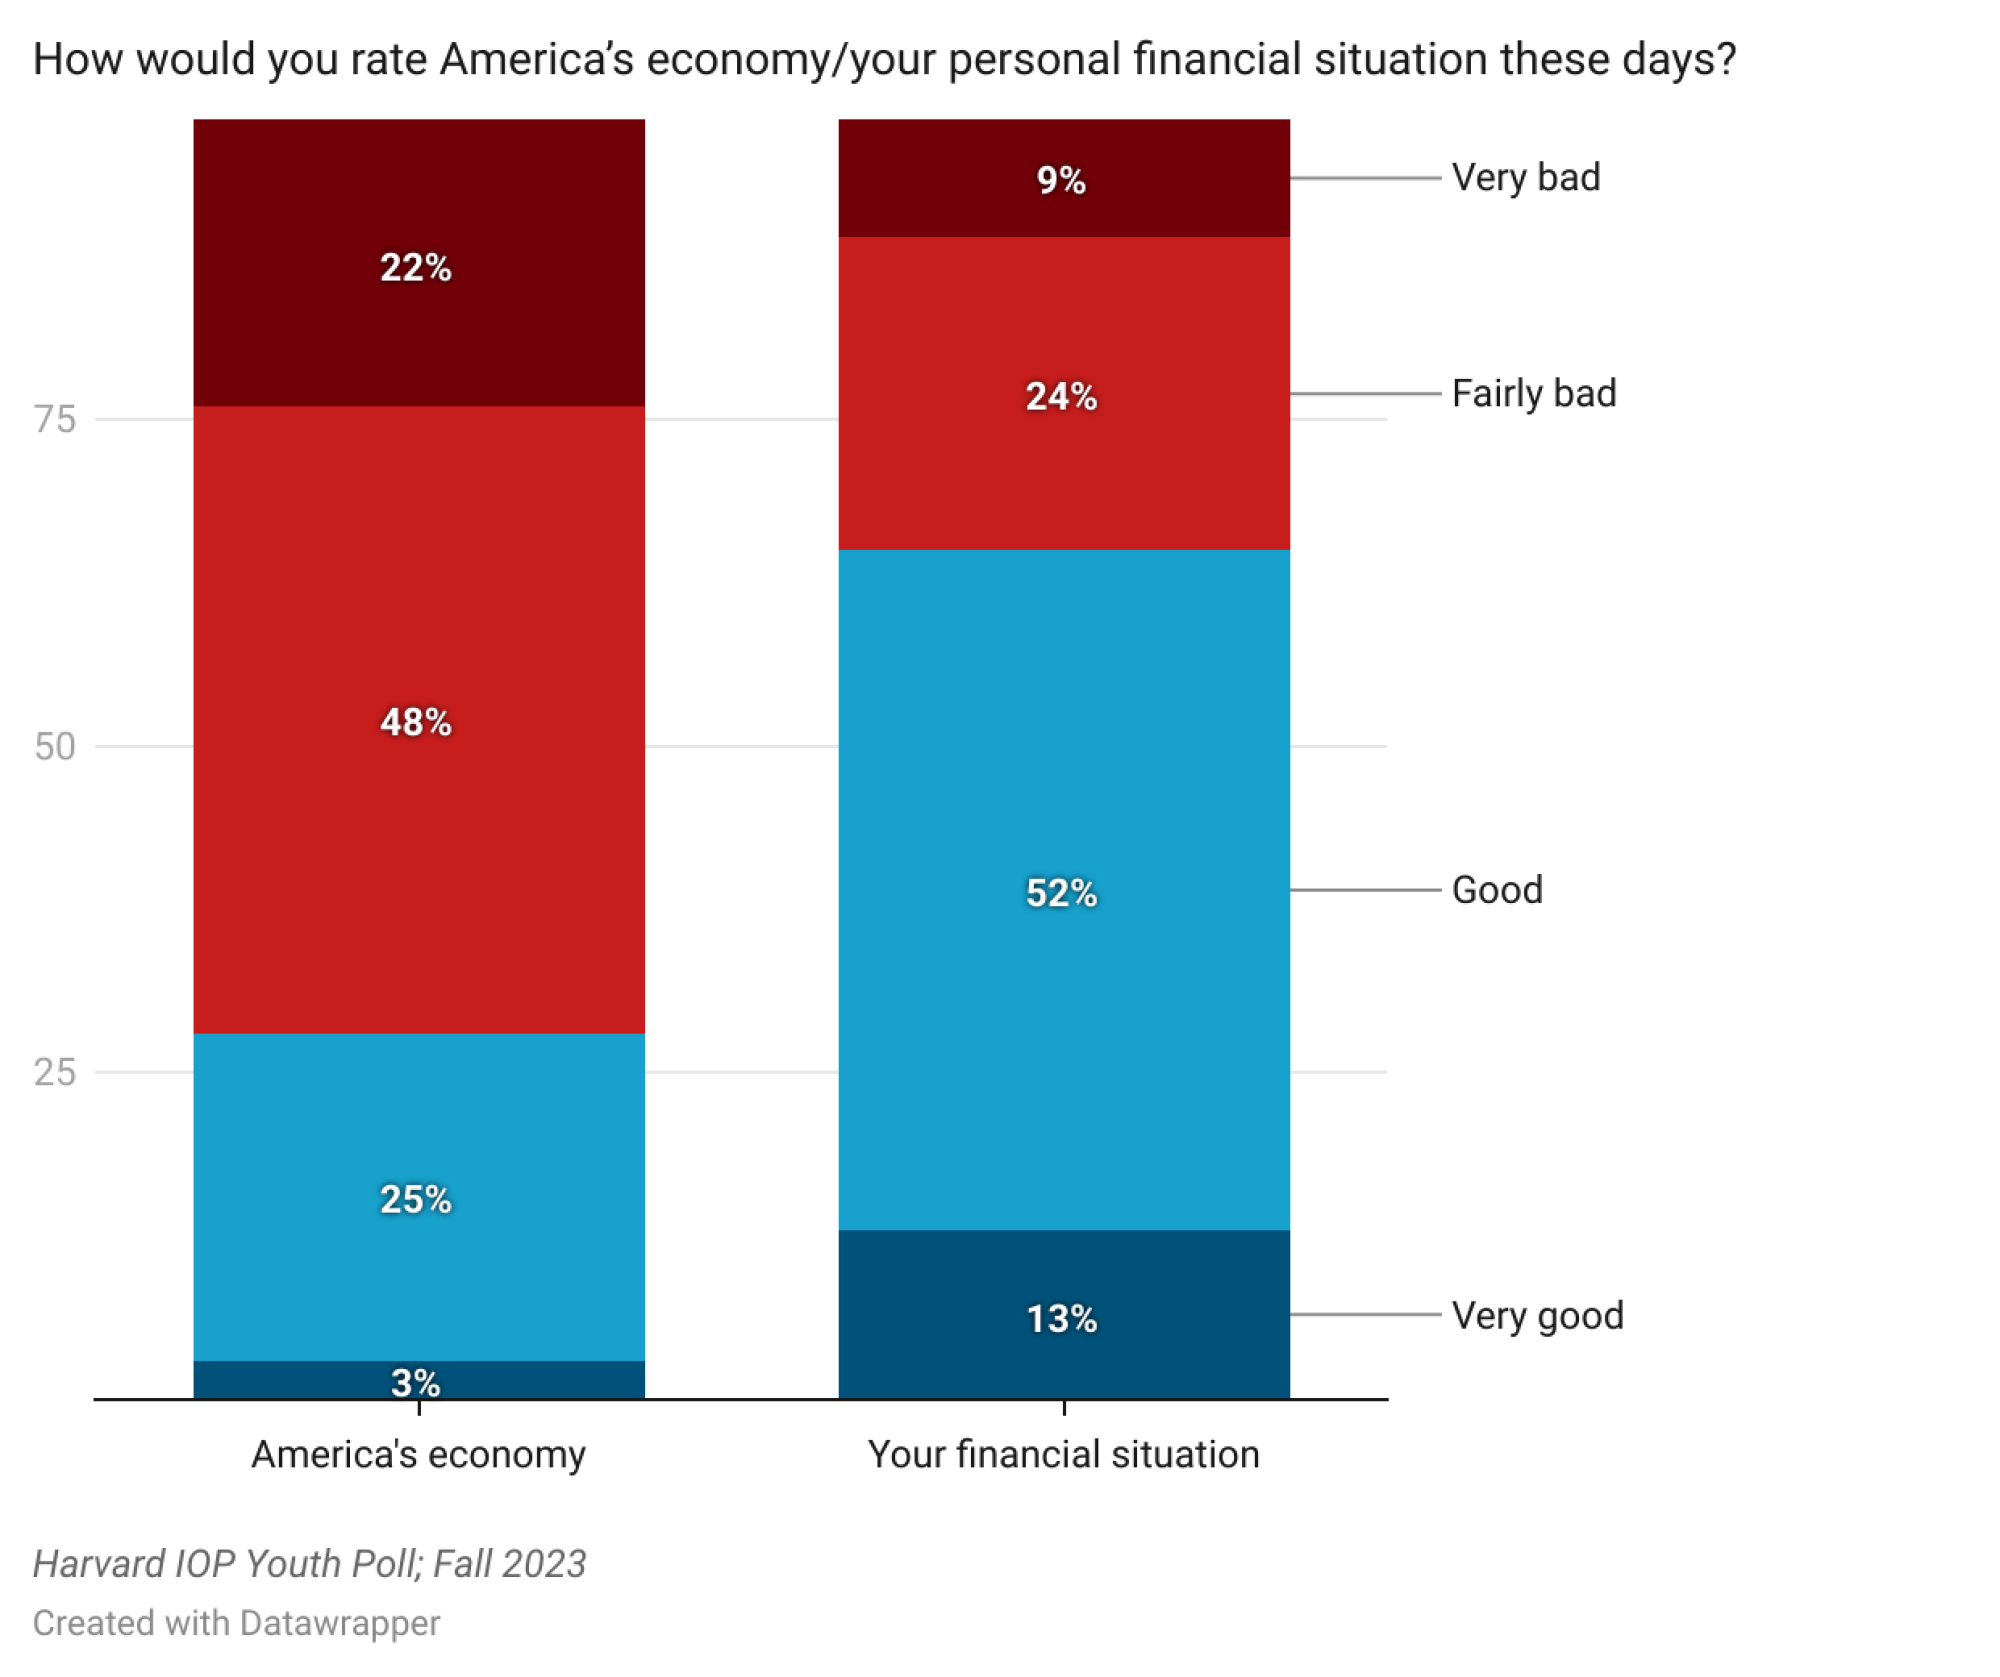
If an economy is a system, and our personal economic health is a branch of it, then how could that branch be fine but the proverbial tree be dead? The gap in responses seen in Figure 1 is non-negligible, and reflects an excessively pessimistic view of the macroeconomy among a large segment of the populace (in this case specifically, the 18-29 demographic). What this means for something like “sentometrics”1 is difficult to ascertain—if we know that consumer sentiment impacts the economy, but we do not know what level of sentiments are reflective of ones that would create an impact, how do we know when the vibes have soured enough for something to change? I am not going to try to explain an answer to that here, but I do want to share a simple observation illustrating this problematic development.
2 Measuring Sentiments
To see how sentiment has changed compared to economic conditions, we need a measure of sentiment and a common economic indicator to compare. To keep things simple, I use consumer price index (CPI?) inflation as the indicator of reference (PCE is better but CPI is what most mass media uses) and the consumer confidence index (CCI?) to measure sentiment. I chose inflation because it is a metric that makes headlines, and which has some correlation with the sentiment metric when plotted. Don’t worry about stationarity econometricians, this is not about the number of inflation, it’s about the number of it that turns heads. I’ve elected to employ a one-month lag of inflation in comparing it to consumer sentiment since it would be the preceding month’s inflation that is known in the month of each consumer confidence survey. The time period of both datasets is January 2010 to June 20242. Before proceeding, only one more thing is necessary.
Although we are using CPI inflation data in this comparison, as mentioned in the above paragraph, we are looking for what makes headlines. This is to say that when inflation is on target, it is unlikely that it is a considerable factor in terms of consumer sentiment. Who was talking about inflation in December of the year 2020? In addition to simply grabbing inflation data, it is necessary to create a benchmark for the kind of inflation that makes headlines. To do this without going through the pain of actually aggregating news articles manually, I use Google Trends with the query “Inflation (Topic)” specifically concerning Google News searches (“Inflation (Topic)” 2024) over the same time frame as the CCI and CPI data. The results below illustrate Google News search interest in inflation over time:
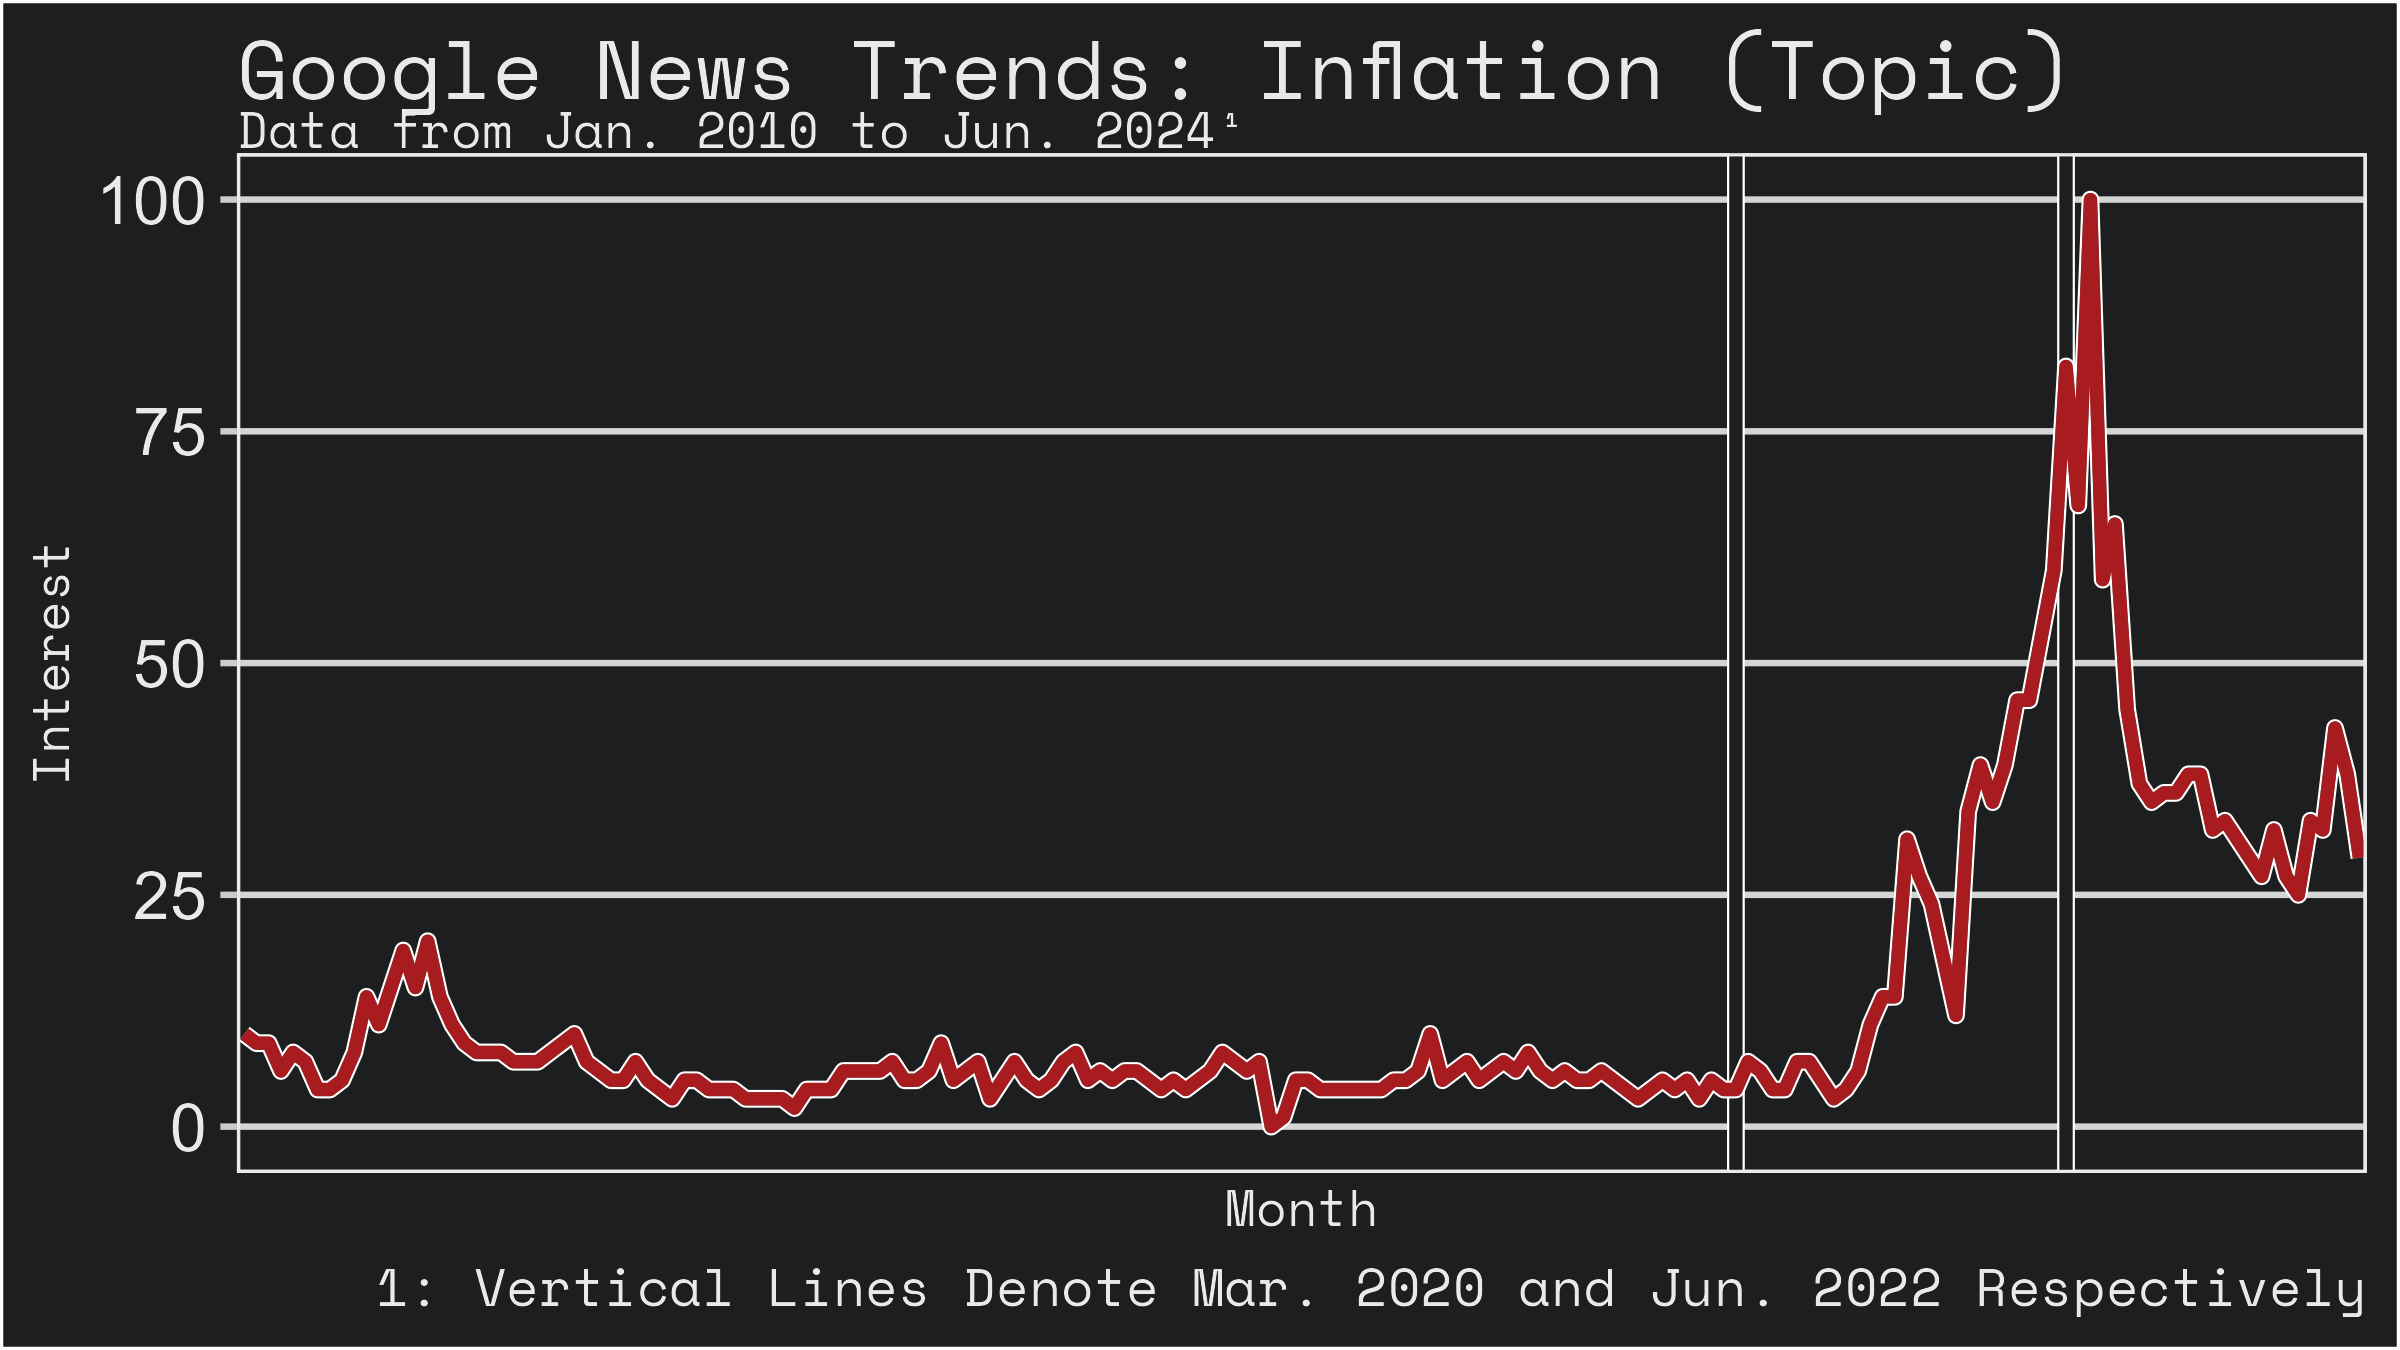
Data from Jan. 2010 to Jun. 2024, Vertical Lines Denote Mar. 2020 and Jun. 2022 Respectively
It is clear from Figure 2 that during the interceding period of relative financial stability between the global financial crisis and the pandemic era, inflation was not really turning heads much. However, since interest is a relative measure, our perception of the data is surely skewed by the seismic nature of the pandemic. If we remove that period and consider only that from January 2010 to January 2020, things look very different:
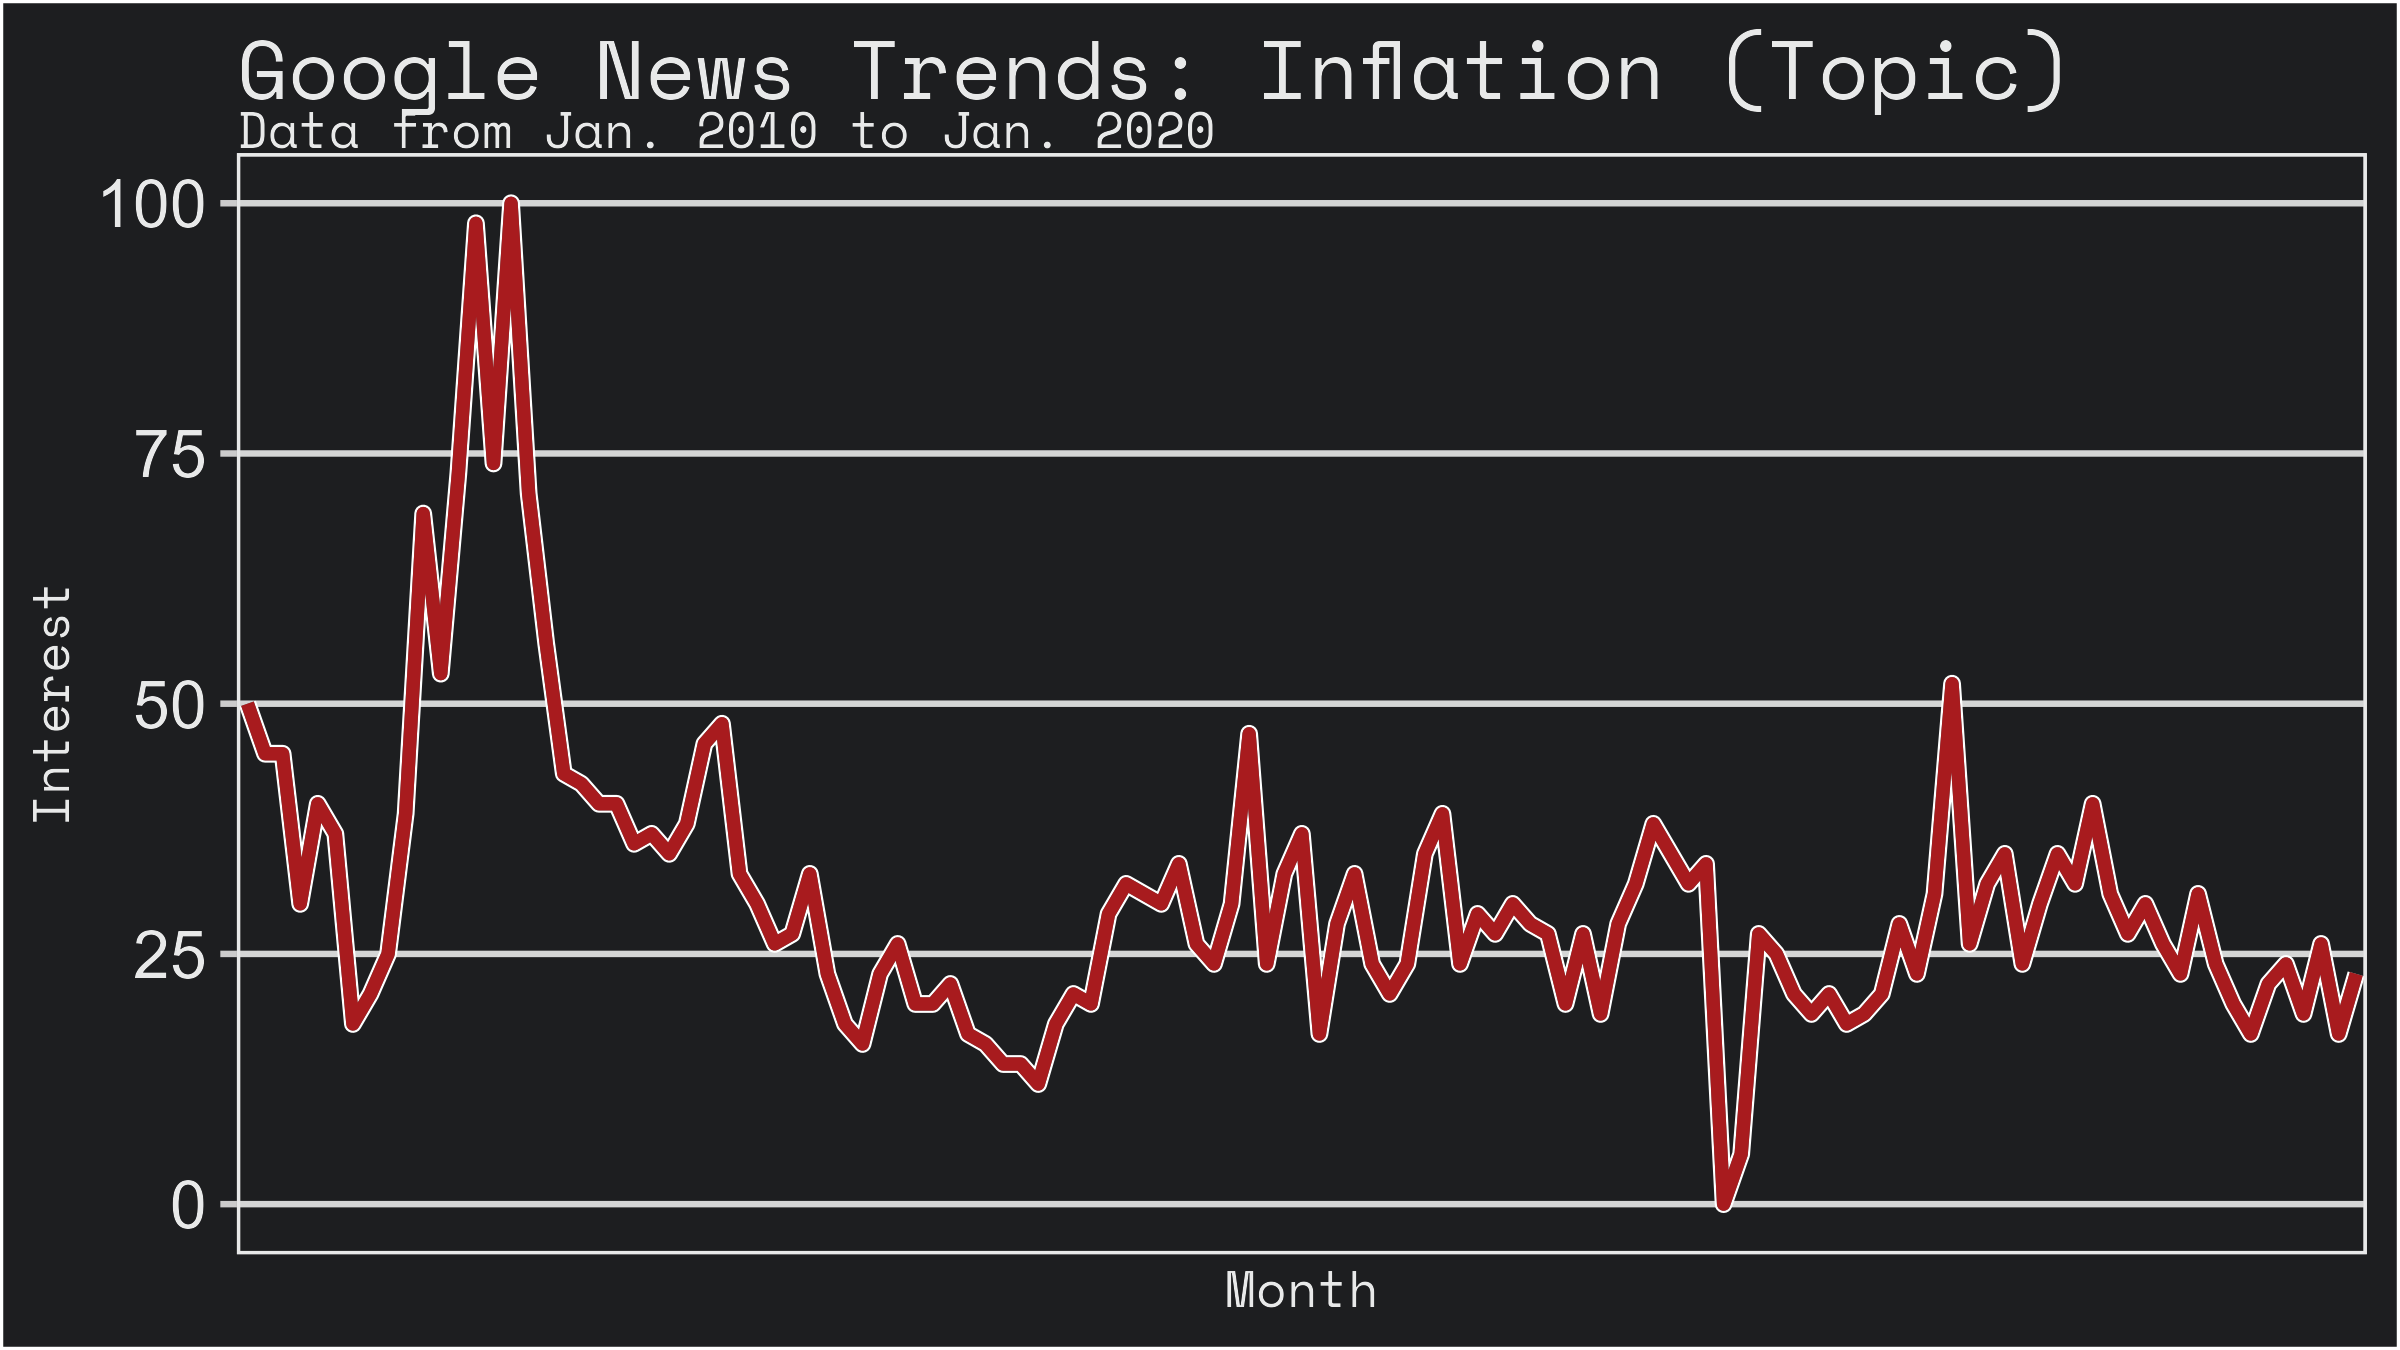
Data from Jan. 2010 to Jan. 2020
What we want is to find a baseline level of inflation that correlates to “disinterest” during the period of stability. In other words, we want to find a general level for the interest trend in inflation as a topic, and see whereabouts inflation tends to be at that level. This level is not entirely representative of what constitutes inflation that makes headlines (for example, periods of particularly low inflation may do the same), but it makes it easier to make an interpretable graph so bear with me. As seen in the collapsed block below, the mean and median levels of interest across the period of interest are 13.55 and 6 respectively.
Given the difference between the first and third quartiles, and how close the mean is to the third, it appears the median is a better result to use here, so I continue with that. Now we adjust the data such that all cases where the trend of interest was above the median are marked as such, and from this we derive the average level of inflation given that interest is above trend3.
Inflation generally starts to turn heads when it hits about 3.168 to 3.71%. That sounds reasonable to my hind brain so we will continue. I elect to include both possible limits for the visual in the next section.
3 Inflation and Consumer Confidence
Below is a graph of inflation and consumer confidence, covering a period from January 2010 to June 2024, with our baseline “head-turning” level of inflation from the prior section included:
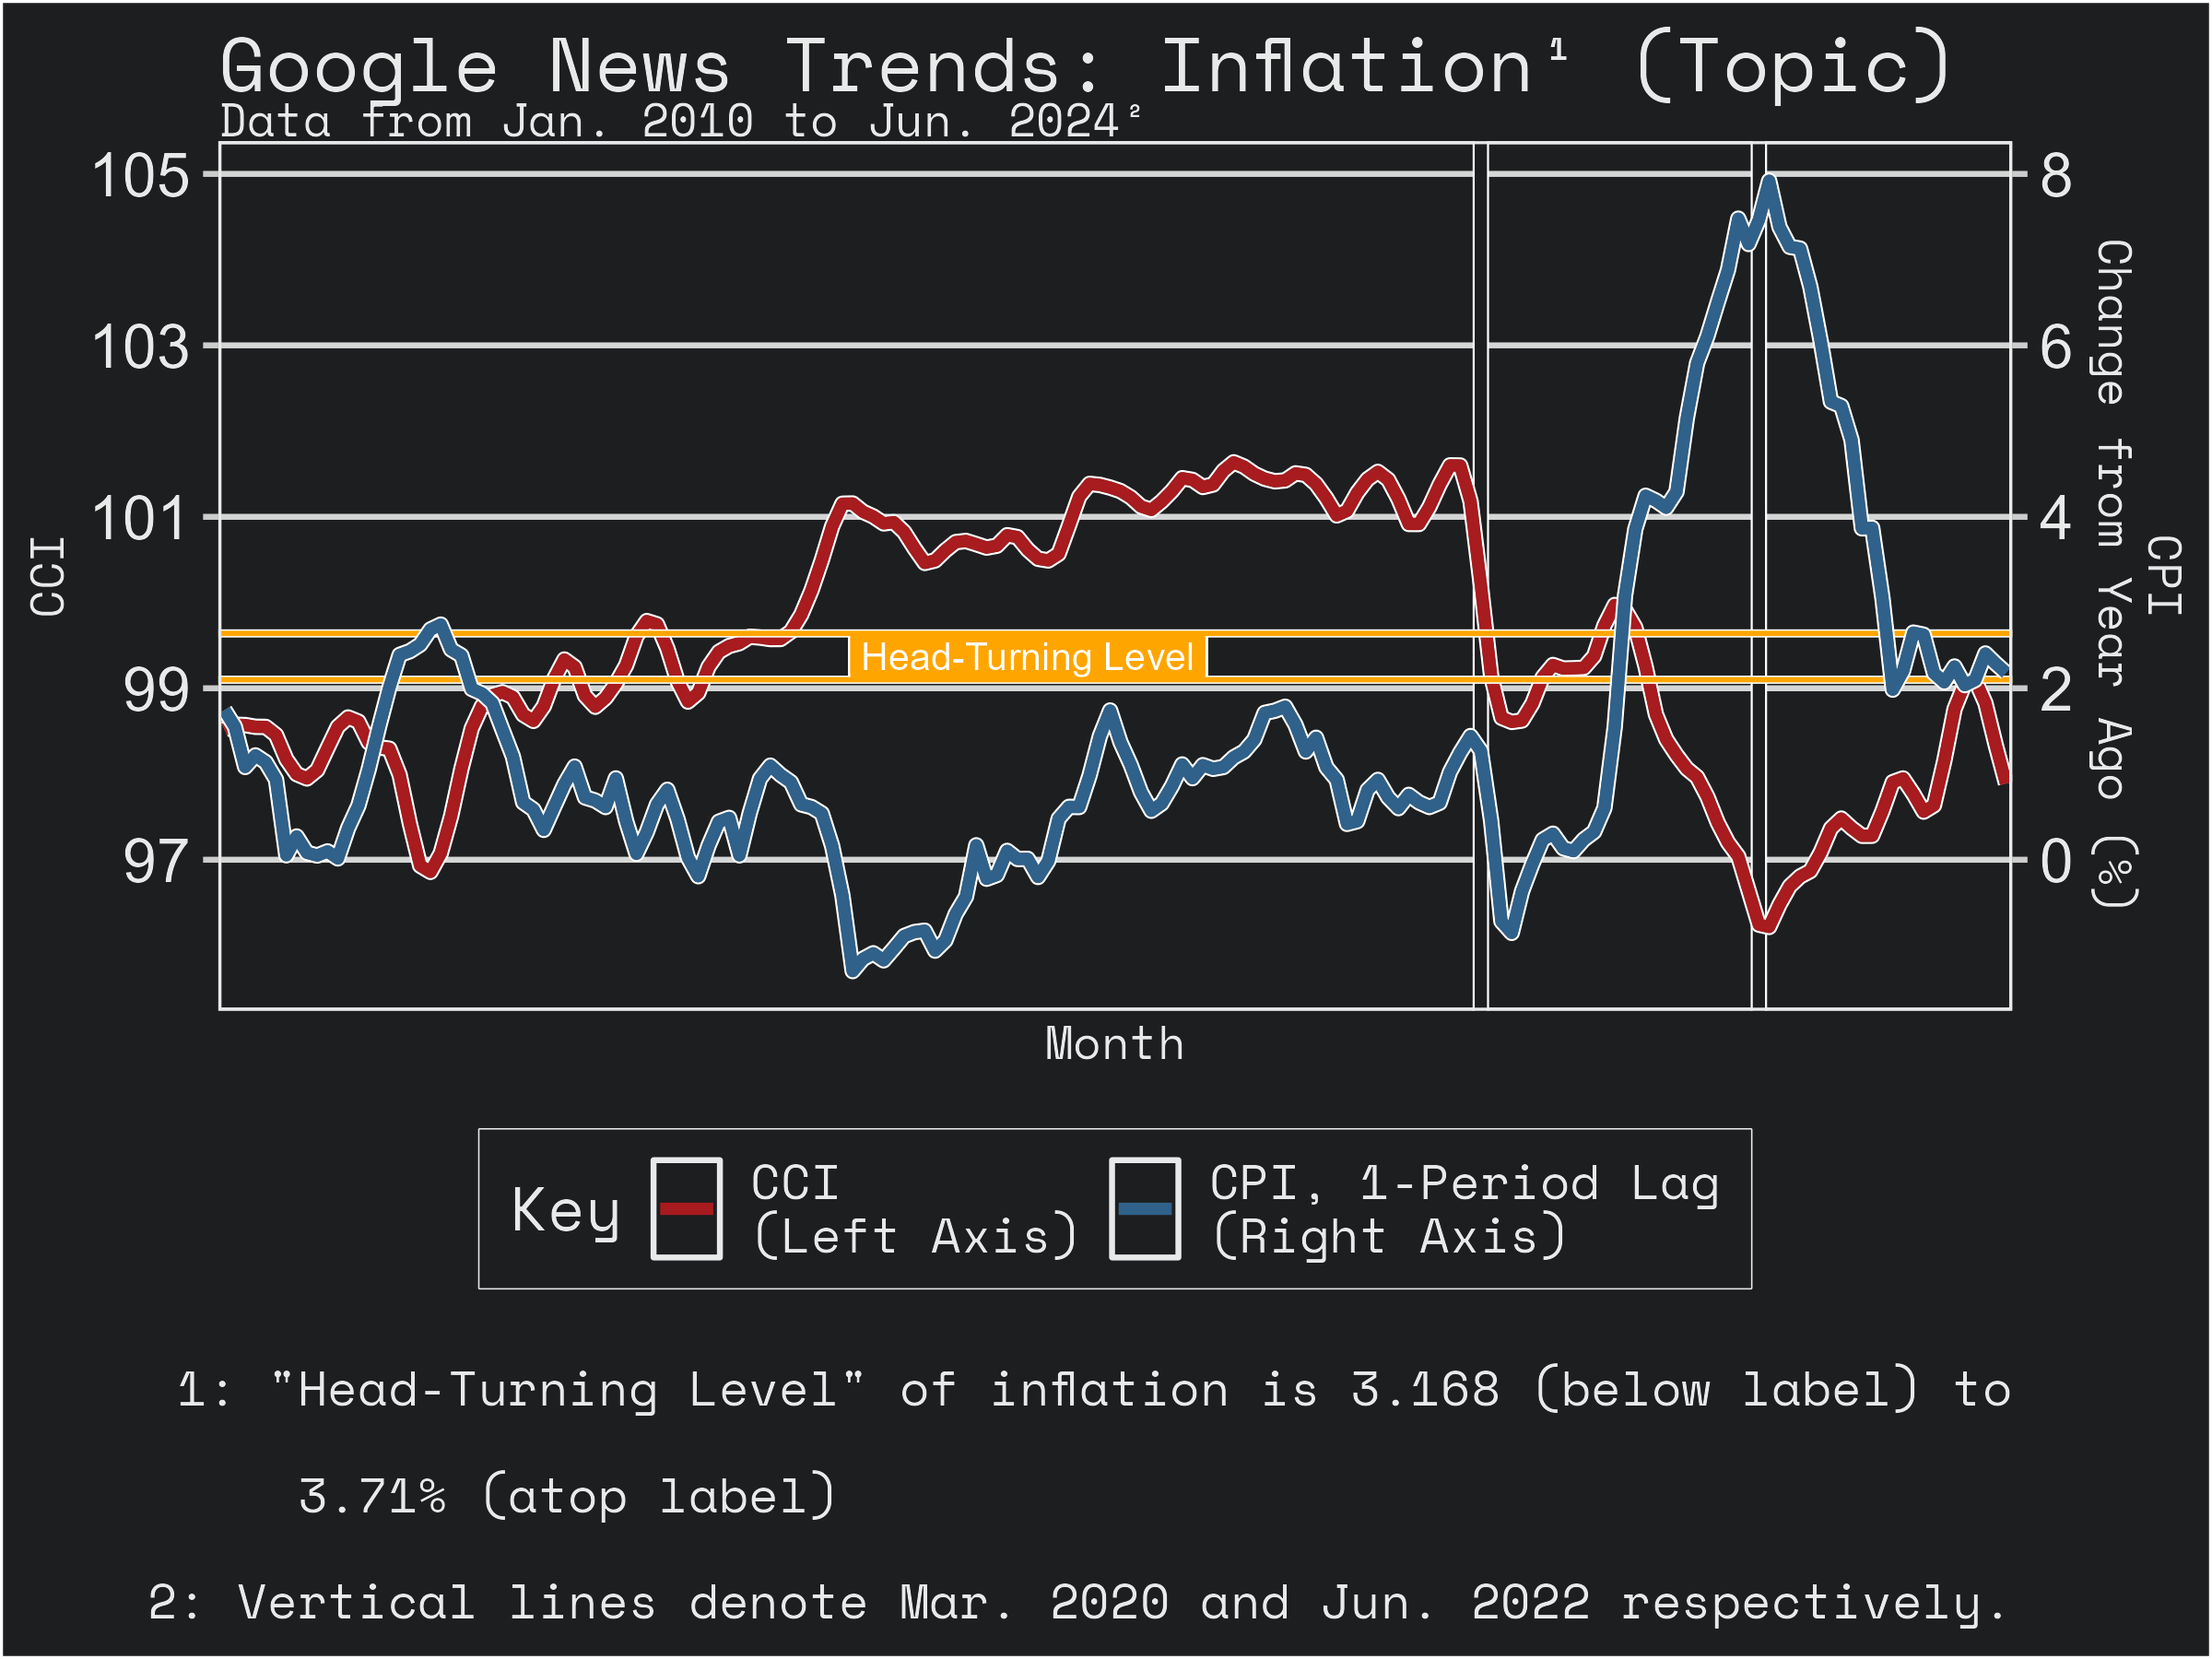
Data from Jan. 2010 to Jun. 2024, Vertical Lines Denote Mar. 2020 and Jun. 2022 Respectively
As seen above in Figure 4, it is generally true that higher inflation in one month is reflected by a lower CCI in the next4, particularly during periods that exceeds the head-turning level. Running a simple test for correlation (in the collapsed block below) we get coefficients of about -0.630 or -0.699 that are statistically significant when including all CPI values or only those where the level of interest in inflation was above the median of 6 (the head-turning level roughly associated with an inflation rate of about 2.68%) respectively. In the years since 2010, we see that low inflation generally resulted in higher consumer confidence and vice versa, and we additionally see that when controlling to focus on inflation during periods where interest of it is higher (which is associated with the “head-turning number” at the higher end of inflation), that relationship is more pronounced.
So we know it should be negative. Anecdotally, it is unlikely that we wouldn’t see a negative correlation between inflation and consumer confidence—not many are made confident by high inflation—so what could be different in different the era of the vibecession5? The size of the coefficients. To investigate if these differences exist, we split the data into pre- and post-vibecession groups.
4 Consumer Confidence Pre- and Post-Pandemic
It’s fair to say the “vibecession” is a pandemic phenomenon, so it is worth looking at the years preceeding March 2020 to see how sentiments may have changed since. In the collapsed block below is another correlation text containing only values from January 2010 to February 2020.
The relationship of inflation and CCI noted from Figure 4 is still present, but notably much-reduced. We get coefficients of about -0.297 or -0.576 that are statistically significant when including all CPI values or only those where the level of interest in inflation was above the median respectively. These are drastically lower than the original coefficients in both cases, implying that the pandemic (and recovery) period will have a much higher associated coefficient. Below is the same test but with values spanning only March 2020 to June 2024.
The relationship of inflation and CCI noted from Figure 4 is still present, but is much higher. We get coefficients of about -0.774 or -0.770 that are statistically significant when including all CPI values or only those where the level of interest in inflation was above the median respectively. Interestingly, the coefficient is greater in magnitude in the latter case than the former, which is a reversal of what we saw in the prior two series of tests. Although almost all periods during the pandemic era had a level of interest above the median, this implies that even in cases where interest was not that high, inflation and consumer confidence were quite high and low respectively. This further illustrates the souring of the vibe during the pandemic and—given that those periods are found in 2020—probably reflect concerns about a recession6 in those instances rather than inflation. The drop in CCI was much more pronounced across the 2022 inflationary wave than other waves in earlier years.
5 Conclusion
As seen in these quick tests, consumer confidence was more negatively impacted in respect to inflation in these past 4 years than it had been in the prior decade. Checking the CCI back to the 1970s, it reached a lower low in 2022 than in the decade of stagflation or the 2008 global financial crisis. Yet consumers still spent—aggregate consumption remained at trend throughout this period. Everything tells us that people were desperately concerned about the economy and yet they did not save and behave as people would historically. Again, the vibe soured, but not enough to significantly change behavior in terms of pure consumption long-term. Even when people weren’t focused on inflation and were pessimistic about a recession they still spent! Surely this isn’t an answer of spending by pure necessity either people bought other goods—look at the market for home office solutions and tell me it wasn’t huge. This begs the same question I asked earlier, how do we know when the vibes have soured enough for something to change?
6 References
Algaba, Andres, David Ardia, Keven Bluteau, Samuel Borms, and Kris Boudt. 2020. “ECONOMETRICS MEETS SENTIMENT: AN OVERVIEW OF METHODOLOGY AND APPLICATIONS.” Journal of Economic Surveys 34 (3): 512–47. https://doi.org/10.1111/joes.12370.
“Harvard IOP Youth Poll.” 2023. Institute of Politics at Harvard Kennedy School. https://iop.harvard.edu/youth-poll/46th-edition-fall-2023.
“Inflation (Topic).” 2024. Google Trends. https://trends.google.com/trends/explore?date=2010-01-01%202024-06-01&geo=US&gprop=news&q=%2Fm%2F09jx2&hl=en.
Scanlon, Kyla. 2022. “The Vibecession: The Self-Fulfilling Prophecy.” Kyla’s Newsletter. https://kyla.substack.com/p/the-vibecession-the-self-fulfilling.